St. Pete & Beaches Waterfront Market Report: August 2026
July had sellers gaining in all six segments. August split three and three. Houses held, condos took the month off, and one 181% number needs explaining.


Last month I told you sellers got closer to asking in all six segments. This month it was three of six. August is like that.
Same rules as always. I start with percent of list instead of the median, because a median tells you which house sold and percent of list tells you what happened in the room.
What sellers actually got
| Market | Type | Aug 2025 | Aug 2026 | Change |
|---|---|---|---|---|
| Treasure Island | Single family | 92.3%* | 95.4%* | +3.1 pts |
| St. Petersburg | Single family | 96.9% | 98.1% | +1.2 pts |
| Treasure Island | Condo | 95.3%* | 95.5%* | +0.2 pts |
| St. Pete Beach | Single family | 93.5% | 93.0% | -0.5 pts |
| St. Petersburg | Condo | 95.5% | 94.2% | -1.3 pts |
| St. Pete Beach | Condo | 95.9% | 94.1% | -1.8 pts |
Stellar MLS closed sales, median percent of last list price, all single-family and condo sales in each city. Treasure Island figures use a June through August window, explained below.
Three up, three down. The single-family houses held or improved everywhere except St. Pete Beach, which slipped by half a point. All three condo lines went sideways or backwards.
That's the month in one table. Houses are fine. Condos took August off.
St. Petersburg proper is still the tight one
This is the only market on the list big enough that you can trust every number in it, so it goes first.
302 single-family sales in August. Sellers got 98.1% of list, up from 96.9% a year ago. Median days on market dropped from 53 to 38. Homes for sale fell from 1,509 to 1,263, and months of inventory went from 4.9 to 4.0.
The median was $420,000, up about 5% from $399,000 last August. Boring. Boring is good.
It did cool a little from July, which it does every year. School starts, everybody who was going to move before school already did, and the rest of us are watching the tropics instead of Zillow.
Four months of inventory and 98 cents on the dollar is still a seller's market if the house is priced right and doesn't have an obvious problem. Those are the ones moving.
St. Pete Beach: fewer houses for sale, and the big ones sold
Seventeen single-family sales in August, same as last August. That's where the similarities end.
There were 100 houses for sale on St. Pete Beach a year ago. Now there are 71. Months of inventory went from 6.9 to 5.3. Median days on market went from 142 to 100, which is still a long time and also six weeks shorter than it was.
Percent of list came in at 93%. In July it was 97%. Before anybody panics, look at what sold. The median sale price in August was $1,250,000. Bigger houses, bigger numbers, and bigger houses negotiate harder. Seven points off a $600,000 house and seven points off a $2 million house are very different conversations, and August was the second kind.
So, same as last month with one change. Inventory is still shrinking. The cheap, damaged stuff is still mostly gone. But the million-plus sellers gave up more in August than the mid-range sellers did in July. If you're listing over a million out there, don't count on 97%.
Treasure Island, measured over a quarter
Treasure Island closed eight single-family sales in August. I'm still not handing you a median off eight sales. So, same as last month, I pulled the whole quarter, June through August, both years.
| Treasure Island | Jun-Aug 2025 | Jun-Aug 2026 |
|---|---|---|
| Single family, median | $765,000 | $1,166,000 |
| Single family, closed | 29 | 25 |
| Single family, days on market | 55 | 128 |
| Single family, % of list | 92.3% | 95.4% |
| Condo, median | $382,000 | $381,095 |
| Condo, closed | 24 | 31 |
| Condo, days on market | 69 | 87 |
| Condo, % of list | 95.3% | 95.5% |
The number to look at is 128. The typical Treasure Island house that closed this summer had been for sale for over four months, against less than two a year ago.
That sounds bad. It mostly isn't. Sellers got 95.4% of list, three points better than last summer. What's closing now is the stuff that sat all spring and finally found a buyer, and it didn't take a big haircut to do it.
The median going from $765,000 to $1,166,000 is the same story as St. Pete Beach. Nobody's house went up 52%. Last summer's sales were heavy on damaged houses and lot-value deals. This summer's are repaired and rebuilt. Different houses, different median.
Twenty-five sales is still a small number. Read the direction, ignore the decimal places.
The condos took August off
St. Petersburg condos had a bad month.
92 closed, down from 115 last August. Sellers got 94.2% of list, down from 95.5%. Days on market went from 60 to 71. There are 947 condos for sale in St. Pete right now. A year ago it was 816.
The median fell from $285,000 to $207,500, and you will see "St. Pete condos down 27%" somewhere this month. That's mix again. The cheaper, older units are what's selling, mostly to cash buyers who read the reserve study first.
One thing going for them. Months of inventory still improved, 8.4 to 6.7, because the last twelve months of condo sales beat the twelve before. August just wasn't one of the good ones.
St. Pete Beach condos did better. Thirteen closed against seven last August, and months of inventory went from 13.3 to 7.5. Percent of list slipped to 94.1%. More are selling, and buyers are still beating them up on price to get there.
Treasure Island has more condos than it knows what to do with. 105 for sale, up from 83, and a little over 14 months of inventory. Sales are up over the quarter, 31 against 24, and the median hasn't moved in a year. If you're buying a condo on Treasure Island, take your time. Nobody's going to beat you to it.
Same advice as last month for anybody who owns one. The milestone inspection and the reserve study decide whether you sell this year or next. Buyers are underwriting the building, not the view.
Now the medians, with the asterisks attached
Here's what you'll see quoted somewhere this month, and what's actually behind it.
| Market | Type | Aug 2025 | Aug 2026 | Closed in Aug |
|---|---|---|---|---|
| St. Pete Beach | Single family | $445,000 | $1,250,000 | 17 |
| St. Pete Beach | Condo | $355,000 | $430,000 | 13 |
| St. Petersburg | Single family | $399,000 | $420,000 | 302 |
| St. Petersburg | Condo | $285,000 | $207,500 | 92 |
St. Pete Beach single family "rose 181%." That is a real number that came out of a real MLS, and it means nothing. Last August the median house that sold on the beach was $445,000, which on St. Pete Beach is a damaged house or a lot with a house-shaped object on it. This August the median was $1.25 million. Seventeen sales both times. Different seventeen houses.
If somebody shows you that number to convince you to list, ask them how many sales it came from. If they don't know, you have your answer about the rest of the presentation.
The St. Petersburg single-family line is the only one on that table I'd quote without a paragraph attached. Up 5% on 302 sales.
How to read any market report without getting worked
- Closed sales first. Under about twenty, treat the median as a story, not a statistic.
- Percent of list second. Hard to fake, and it tells you what negotiating power actually looks like.
- Days on market third. Rising days plus a rising median means the mix changed, not the market.
- Months of inventory last. Under four favors sellers. Over six favors buyers. In between depends entirely on the house.
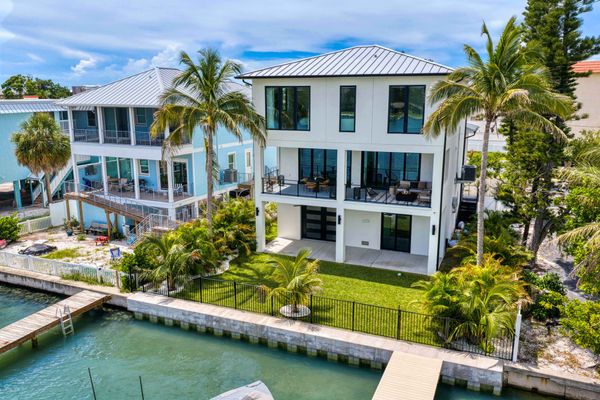
- Then close the spreadsheet and go look at the water. Depth at low tide, bridge clearance, seawall condition and which way the dock faces don't show up in a city-level number. Two houses on the same canal can be six figures apart for reasons no chart will ever show you.
If you're buying
How much room you have depends on what you're buying.
A house in St. Petersburg proper: not much. Four months of inventory, 38 days, 98% of list. Don't expect a discount.
A house on the beaches: some, and it's shrinking. St. Pete Beach has 29% fewer houses for sale than a year ago. The ones that have been sitting 100-plus days are where the conversation is.
A condo anywhere: plenty. Inventory is up in St. Pete and on Treasure Island, sellers are giving up around five points, and nobody is going to outbid you while you read the milestone report. Read the milestone report.
And the usual. Insurance and elevation decide more of your monthly payment than the purchase price does. Get the elevation certificate and a real insurance quote before you fall for the house. If it needs work, the 50% rule decides whether you bought a renovation or a teardown.
If you're selling
Houses: price it right and you get close to asking. Price it hopeful and you get time. 100 days on St. Pete Beach and 128 on Treasure Island is what hopeful costs, and you're paying insurance and taxes the whole way.
If you're over a million on the beach, plan for a harder negotiation than the 97% I quoted last month. August buyers at that level got 93%.
Condos: there are more units for sale than a year ago, so your paperwork has to be better than the unit next door's. Milestone inspection, reserve study, assessment history, all of it in the listing packet before anyone asks.
Snowbird season starts in about six weeks, and those buyers are already scrolling from somewhere cold. If you want to be on the market when they land, get the house ready now.
The one-line version
St. Petersburg houses are tight and getting tighter, beach houses have a lot less competition than a year ago but the expensive ones are negotiating, condos had a soft August, and the 181% you're about to see quoted is seventeen different houses.
If you want these numbers run for your specific street instead of your whole city, that's a text away. I like this stuff more than is probably normal.
Frequently Asked Questions
Did St. Pete Beach home prices really rise 181% in a year?
No. The median sale price went from $445,000 in August 2025 to $1,250,000 in August 2026, on 17 sales each time. What changed is which houses sold. Last August was mostly damaged homes and lot-value sales. This August was repaired, rebuilt and higher-end homes. Individual home values did not nearly triple.
Is St. Petersburg a buyer's or seller's market right now?
For single-family homes in St. Petersburg it leans seller. August 2026 had 4.0 months of inventory, a 38-day median days on market and sellers getting 98.1% of list on 302 closed sales. Condos are different: 6.7 months of inventory and 94.2% of list, which favors buyers.
Why are Treasure Island homes taking so long to sell?
Median days on market for Treasure Island single-family homes was 128 for June through August 2026, up from 55 a year earlier. Most of what closed this summer was inventory that had been sitting since spring. Sellers still got 95.4% of list, up from 92.3%, so the homes are clearing without deep discounts.
Are St. Pete condo prices falling?
The median St. Petersburg condo price fell from $285,000 to $207,500 year over year in August, mostly because cheaper, older units made up more of the sales. Closed sales fell from 115 to 92, condos for sale rose from 816 to 947, and sellers got 94.2% of list.
Why use a three-month window for Treasure Island?
Because eight sales in a month can't support a median. Widening to June through August gives 25 single-family sales and 31 condo sales, which is enough to read a direction. It's still a small market, so trust the trend and not the decimals.